
Building a machine learning (ML) model from scratch is no easy task. Not only is it nearly impossible to judge the success of a model in making predictions, but it can also be challenging to understand when a model is not performing as it should or giving incorrect predictions.
This is because ML performance isn’t static. ML models are trained on historical data, and while they might work great with this training data, that doesn’t mean they’ll work well with real-world data, which can change drastically and rapidly.
This problem, known as data drift, can be a real problem when using machine learning in the real world, where data always changing due to customer preferences, economic factors, and even the weather.

This article tells you everything you need to know about data drift, including what it is, why it’s a problem, and how to detect it when training ML models.
What is data drift?
Data drift is the unexpected change or shifts in the statistical properties of the data that a machine learning model relies on.
The shift happens when the distribution, schema or source of the input data changes over time, preventing the ML model from accurately making predictions based on that data.

Data drift with the dotted line representing accuracy.
Data drift is a problem because it makes the model's predictions unreliable. As the data a model is based on drifts away from real-world data, the model's predictions become less accurate.
Imagine, for instance, an ML model trained on old phishing emails designed to flag suspicious emails a spam. If the criminals behind these emails change their techniques or format, it could throw the model off complexity, leading to important emails being flagged as spam and phishing emails slipping through the cracks.
Types of data drift
Data drift can be categorized into two main types based on how the underlying data changes in relation to the model's expectations:

When Data Strategy Leads AI
Why leaders must treat data quality, ownership and governance as the first phase of AI delivery, not a back-office cleanup task.
1. Concept Drift
Concept drift occurs when the relationship between the model's inputs and outputs changes over time. In other words, what used to be a good predictor of the outcome might no longer be as relevant.
For example, if a model is trained to predict customer churn based on website visits and the company launches a new loyalty program, the website visits might become less important for predicting churn, and the model's accuracy would suffer.
2. Covariate Shift
This type of drift affects the distribution of the data itself, even if the underlying relationship between features and targets remains the same. This means that due to some environmental change even though the relationship between feature X and target Y remains unchanged, the distribution of feature X has changed
Imagine a model that predicts housing prices based on square footage and neighbourhood. If a new highway is built near a previously affordable neighbourhood, driving up property values, the model's predictions for that area would become inaccurate without retraining. This would cause a covariate shift unless the model is trained of more up-to-date with the new prices.
Inside Modern ETL Architectures
What differentiates leading ETL platforms across connectivity, automation, and scalability for warehouses, lakes, and real-time pipelines.

3. Prior Probability Shift (Shift in the target variable)
With prior probability shift, the distribution of the input variables remains the same but the distribution of the target variable changes. This shift in the target variable's distribution can cause problems because the model's assumptions about the likelihood of different outcomes become incorrect, leading to inaccurate predictions.
Continuing the spam filter example, it could be that the volume of spam emails has increased significantly, meaning that predictions about the likelihood of different outcomes (e.g., spam vs not spam) are no longer valid.
What causes data drift?
Data drift can’t be traced back to a single problem, but rather a combination of factors that can change the data a machine learning model relies on. These factors include how the data is collected or measured, and changes in the underlying phenomenon the data represents.
Even without dramatic changes to data, real-world conditions can subtly shift over time. Customer preferences evolve, economic factors fluctuate, and even seasonal changes can impact data. A model trained on past data might not capture these ongoing changes because the data it’s trained on is outdated.

How data is collected and formatted can change too. New data sources might have different formats or measurement scales, or even existing data collection methods could be tweaked, causing inconsistencies with the historical data the model was trained on.
The meaning behind the data can also drift, even if the format stays the same. For instance, a surge in website traffic might have indicated a marketing campaign in the past, but now it could signal a cyberattack. The model needs to adapt to understand these changing interpretations.

Mitigating Data Chaos with MDM
Boards are confronting compliance, trust, and reporting risks by hardening core records and governance through enterprise-grade MDM.
How to detect data drift
Detecting data drift is crucial for maintaining the effectiveness of your machine-learning models. Here are some common methods:
1. Statistical monitoring
Statistical tests compare the distribution of features in your new data against a historical baseline, which is typically established using past, reliable data. These tests can identify changes in things like mean, median, variance, or even the entire shape of the distribution – all of which could signify data drift.
There are several statistical tests used for data drift detection. Some popular choices include:
- Kolmogorov-Smirnov (K-S) test: This compares the cumulative distribution of two datasets to identify deviations. It is often used to test whether a sample of data comes from a specific population or to compare two samples to determine if they come from the same population.
- Chi-square test: This is useful for categorical data. It can be used to identify changes in how frequently certain categories appear over time.
- Population Stability Index (PSI): This measures the difference between the expected and actual distribution of a feature, often using binning to segment the data. It is commonly used to monitor changes in the characteristics of a population and to identify potential problems with the performance of a machine learning model.
Why Boards Must Own AI Bias
Bias in AI is now a board-level issue. See how governance, culture, and oversight must adapt as algorithms shape hiring, health, and credit.

2. Hypothesis testing
Hypothesis tests such as t-tests compare things like means and variances to determine whether data drift is present in an ML model.
You start by defining a null hypothesis (H0) that states there's no difference in the distribution of a specific feature between your training data and the new data you're feeding the model. The test then generates a p-value, which represents the probability of observing the data difference by random chance alone.
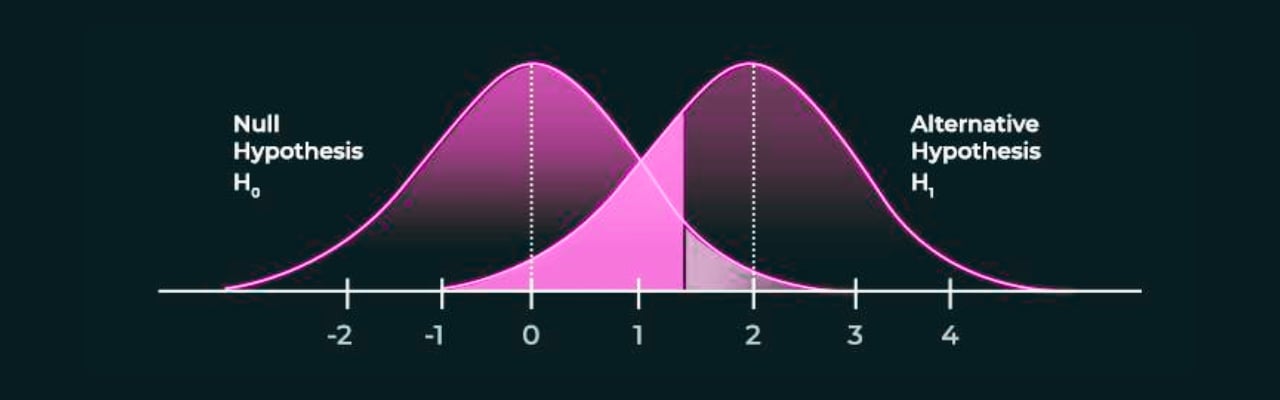
A pre-defined threshold (often set at 0.05) determines the significance level. If the p-value falls below this threshold, you reject the null hypothesis (H0). Rejecting H0 suggests that the observed difference in feature distribution between the datasets is statistically significant, potentially signifying data drift.
2. Machine learning for drift detection
Another option for detecting data drift is train a separate ML model to identify any changes in the outputs. drift. This model can be trained on historical data that is labeled as "drift" or "no drift." Then, when new data arrives, the model can be used to predict whether or not there has been a drift.
3. Model performance monitoring
While not a direct measure to detetcing data drift, tracking the performance of your machine-learning model over time can provide clues that data drift is present.
You monitor key metrics like accuracy, precision, recall, or F1-score for classification tasks, or mean squared error (MSE), mean absolute error (MAE), and R-squared for regression tasks. A sudden drop in these metrics can indicate a mismatch between the data the model was trained on and the data it's currently encountering. This mismatch could be due to data drift.
Can you solve data drift?
Data drift can’t be solved because it’s a natural consequence of our ever-changing world. However, there are ways to mitigate its impact and ensure your machine learning models stay accurate and relevant.
One of the most common approaches to this is to retrain your model with fresh data that reflects the current distribution so the model adapts to the data drift and improves its accuracy again. Depending on the severity of the drift, you might retrain with a mix of old and new data, prioritize recent data, or even discard outdated data entirely.
When building your model, you can also consider features that are less sensitive to data changes. For instance, instead of raw income, you could use income brackets or income growth rates, making the model less susceptible to fluctuations in individual incomes and in turn data drift.
The key is to be vigilant. Regularly monitor your data for signs of drift using the detection methods we discussed earlier so you can catch drift early and take action before it significantly affects your model.
Final Thoughts
Real-world data constantly evolves, so drift is something you should expect in any machine learning system that relies on historical data. The sooner you identify drift, the faster you can take corrective actions to mitigate its impact on your models' performance.
Make data quality and drift detection a core part of your machine learning workflow. By staying vigilant and adapting to changing data patterns, you can ensure your models deliver reliable results over the long term.


Comments ( 0 )