

Enterprises of all shapes and sizes have data pouring in faster than ever. And not only does governance have to keep pace with this, but organisations also need to turn that data into useful information quickly enough to act on it. After all, knowing something went wrong yesterday isn't much help when you could've prevented it today.
Real-time data analytics helps organisations make decisions based on what's happening now, rather than waiting hours or days for the next report. And it's becoming a priority for enterprise investment. According to Confluent's 2026 Data Streaming Report, 88 per cent of IT leaders rank data streaming as a high investment priority.

But getting to real time at an enterprise scale still depends on clean integration, dependable data quality and choosing the right tools for the job.
What Real-Time Data Analytics Really Means for Enterprises
Real-time analytics isn’t just a prettier, faster dashboard. It's analysis that happens as data arrives, so teams can see what's happening and act while events are still unfolding. Unlike traditional batch processing, which analyses data at scheduled intervals, real-time analytics works with incoming data as it's generated.
In practice, that could mean detecting an operational issue within seconds of it occurring, rather than discovering it hours later in a daily report. The aim is to capture and process incoming data quickly enough to produce useful insights or trigger an action while there's still time to respond. This is particularly valuable for AI and automation systems that rely on up-to-date information.
Think on-site personalisation as a customer clicks, or network monitoring systems raising an alert the moment unusual behaviour is detected. To support these applications, real-time pipelines need to be reliable, scalable and governed to maintain data quality. But real time isn't an absolute measure of speed.
Some applications need responses in milliseconds, while others can work with delays of several seconds or longer. What matters is whether the information arrives quickly enough to serve its purpose.
What's changed is that modern streaming technologies make it possible to process and analyse data continuously, bringing operational systems and analytics closer together. In fact, according to Apache Kafka, more than 80 per cent of Fortune 100 companies use its streaming platform, showing just how widely the technology has been adopted by major enterprises.
Why Real-Time Data Analytics Always Matters
Enterprises can't always afford to wait hours or days to find out what's happening across their operations. Sometimes, even a few minutes can make a difference. Real-time data analytics gives organisations the information they need to respond while events are still unfolding, whether that means preventing fraud, resolving a technical issue or making a decision before an opportunity passes.
Take financial technology company Ramp, for example. After moving its fraud detection system to Materialize, the company reported a 60 per cent reduction in account takeover attacks, with half of compromised accounts flagged at no additional cost.
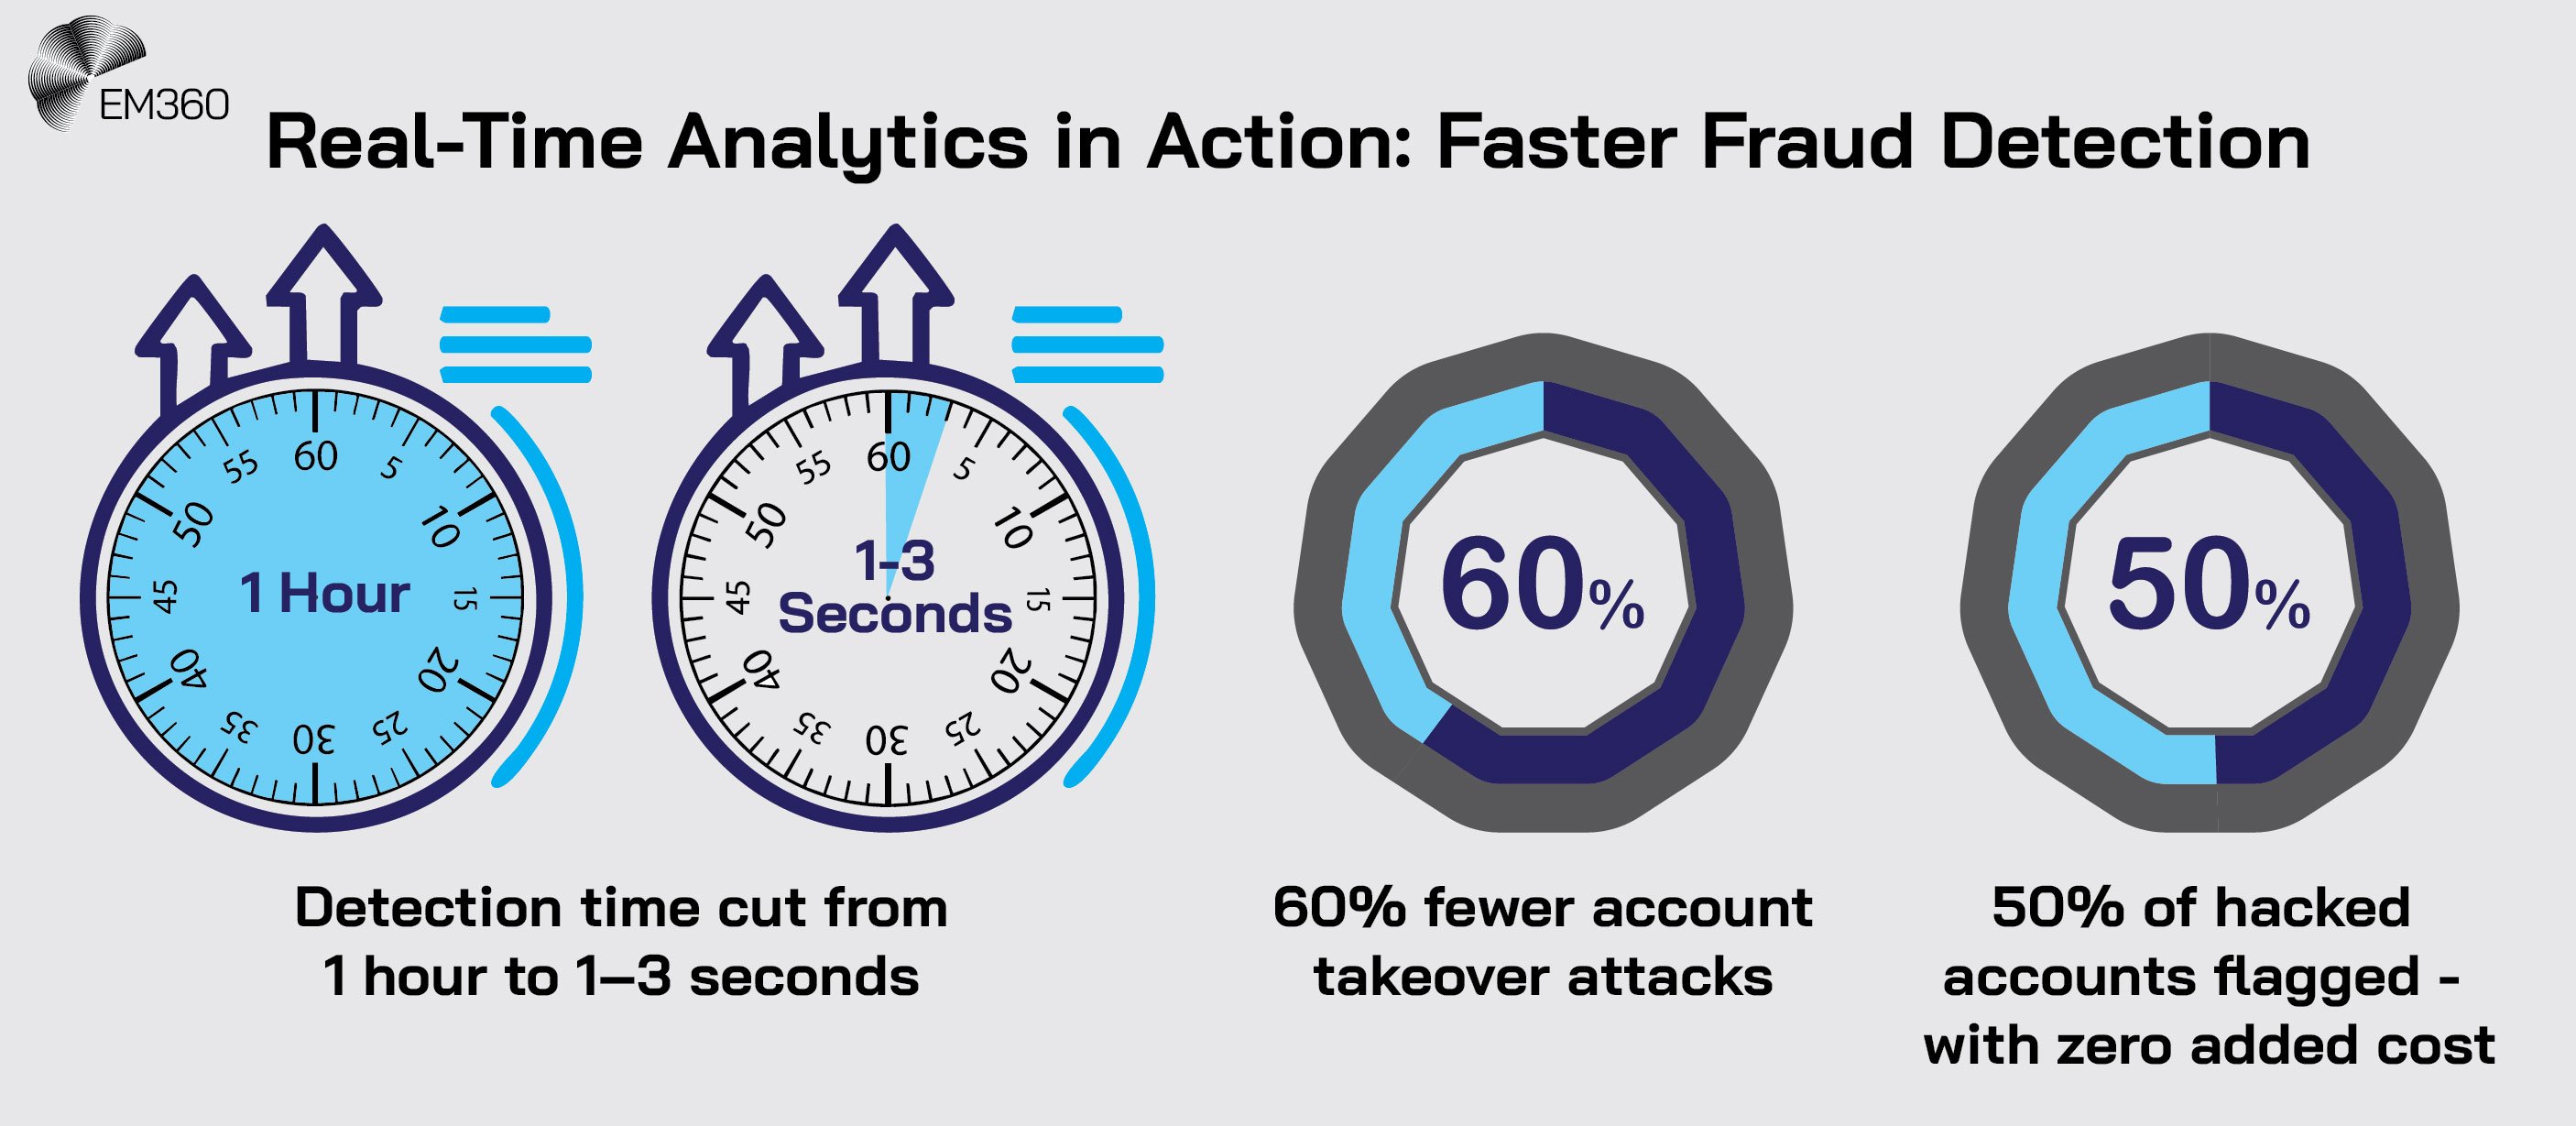
Its previous analytics system updated data hourly, which meant fraudulent activity could go undetected until the next update. With real-time analytics, Ramp could identify suspicious behaviour and act much sooner. Real-time pipelines let teams detect and resolve operational problems before they escalate.
They also make it possible to respond to customer behaviour as it happens, adjusting recommendations, offers or content based on what someone is doing at that moment. And when it comes to risk management, having current information about transactions, systems and supply chains gives organisations a better chance of spotting problems before they cause serious damage.
There's a financial case for investing in these capabilities, too. According to Confluent's 2026 Data Streaming Report, 50 per cent of surveyed organisations reported returns of at least five times their investment in data streaming.

Inside World Cup Data Decisions
How World Cup operations turn real-time data into decisions, offering a blueprint for enterprises running distributed digital services.
Separately, a Forrester study commissioned by Confluent found that organisations represented by its composite model could save more than $2.5 million over three years through reduced development, operational and infrastructure costs. These findings come from different studies, so they shouldn't be treated as a single measure of return.
Real-time analytics is also becoming increasingly important for AI. Machine learning models and automated systems often need current information to make useful decisions, particularly when circumstances can change quickly.
According to an IDC study commissioned by Solace in 2026, organisations with the most mature real-time data capabilities were more than three times as likely to report measurable results across the majority of their AI projects. That doesn't mean faster data alone guarantees better AI, but it does show how closely the two are connected.
The value ultimately depends on what an organisation needs to do with the information. A fraud detection system might need to respond in seconds, while a supply chain team could have more time to assess a disruption. In either case, real-time analytics gives people and systems the chance to act while the information is still useful.
Key Trends Powering the Real-Time Analytics Revolution
The shift towards continuous data processing is changing how enterprises manage their infrastructure, analyse information and support AI applications.
Three developments are shaping the real-time analytics market: the closer integration of cloud services, the growing capabilities of streaming databases and the need to keep data fresh as more business processes become automated.
Cloud-native streaming architectures are becoming the norm
Enterprises are increasingly turning to managed cloud services for streaming and analytics. AWS, Microsoft Azure and Google Cloud offer tools for collecting, processing and analysing incoming data without organisations having to manage every part of the underlying infrastructure themselves. These services can also make it easier to adjust capacity as workloads change.
Building Real-Time AI Workflows
Re-architect data, analytics and control paths so real-time signals arrive with context, clear owners and executable actions.

At the same time, data warehouses and lakehouse platforms are bringing streaming ingestion and analytics closer together. Instead of moving information between several separate systems, teams can manage more of the process within an existing data platform. That can reduce integration work, although it doesn't automatically solve governance problems or guarantee lower latency.
Organisations still need to consider how their data moves, where it's stored and how quickly it needs to be available. The market is expected to grow considerably, too. According to 360iResearch's September 2026 forecast, the global streaming analytics market is projected to reach $87.27 billion by 2032, up from an estimated $33.39 billion in 2026.
The forecast covers streaming analytics more broadly, rather than cloud-native services alone, but it reflects the growing market for technologies that help organisations process and act on data as it arrives.
Streaming databases bridge the gap between analytics and operations
Streaming databases make it possible to work with continuously changing data using SQL, the language commonly used to query databases. Platforms such as Materialize and RisingWave can update stored query results as new events arrive, rather than repeatedly processing the entire dataset.
This means dashboards, business metrics and application features can stay current without waiting for scheduled updates. Real-time analytical databases such as Apache Pinot take a slightly different approach. They're designed to handle fast queries against large volumes of incoming data, making them useful for interactive dashboards, operational monitoring and customer-facing analytics.
Both types of technology help organisations use fresh data, but the distinction is important when choosing a platform. One focuses on continuously maintaining results, while the other is built to answer analytical queries quickly.

AI and automation are driving demand for data freshness
AI systems that respond to changing conditions need access to information that reflects what's happening now. Fraud detection models, personalisation engines and predictive maintenance applications can all benefit from incoming data that hasn't been sitting in a database for hours.
But the information also needs to be accurate and relevant, or faster processing won't necessarily lead to better decisions. This is becoming a practical challenge for enterprises.
Why Enterprise AI Needs Data Analytics That Keeps Contextual Pace
AI is moving into live business operations, speedy real-time analytics helps keep the view on changing conditions to support timely, reliable decisions.
The 2026 Data Streaming report from Confluent found that 72 per cent of surveyed IT leaders identified insufficient infrastructure for real-time data processing as a challenge when scaling AI.
Another 66 per cent reported uncertainty about data lineage, timeliness and quality, showing that getting information to AI systems quickly is only part of the problem.
In practice, a contact-centre assistant might use recent customer interactions to provide more relevant guidance, while a supply chain system could combine live shipment updates with other information to identify possible delays. Generative AI applications face similar requirements when they need current business data to answer questions or support decisions. For enterprises choosing an analytics platform, the question is whether it can deliver information that's both fresh enough and reliable enough for the job.
How To Evaluate a Real-Time Analytics Platform
Choose on evidence, not hype. Focus on how each platform performs with your actual workloads, how well it fits your existing architecture and what it will take to run and maintain over time. The fastest option isn't necessarily the best one if it introduces unnecessary costs or complexity.
Core evaluation criteria
When Real Time Meets Batch
Why leaders are pairing streaming with batch to align AI, analytics and operations, instead of forcing a single data processing model.

- Latency and throughput: Measure how quickly data moves from ingestion to a usable result, and how much the platform can process under normal and peak loads. Test against your actual workloads rather than assuming every application needs sub-second performance.
- Scalability and reliability: Look for automatic scaling, resilience across availability zones or regions, and recovery features such as checkpointing. Check where exactly-once processing is supported, as guarantees can depend on configuration, connectors and the systems receiving the data.
- Integration: Verify native connectors and APIs for Kafka, Kinesis, databases, object storage, business intelligence tools and alerting systems. The fewer custom integrations you need to build and maintain, the easier implementation becomes.
- Security and governance: Check for encryption, fine-grained access controls, schema validation, data lineage and audit logs. These controls help organisations manage who can access streaming data, where it comes from and how it's used.
- Developer experience and observability: Consider how easily your team can work with the platform using familiar tools such as SQL and Python. Clear metrics, logs and alerts are equally important for identifying problems and understanding how pipelines are performing.
- Cost and operational requirements: Look beyond the advertised price. Continuous compute, ingestion, storage, data transfer and ongoing maintenance can all affect the total cost. Consider whether your team has the skills to manage the platform or would benefit from a fully managed service.
Architectural fit
- Streaming databases: Platforms such as Materialize and RisingWave continuously process incoming data and maintain updated query results. They're useful when applications, dashboards or operational systems need information that changes as new events arrive.
- Real-time OLAP databases: Apache Pinot and ClickHouse are designed for fast analytical queries across large datasets, including recently ingested events. They're particularly useful for interactive dashboards, monitoring and customer-facing analytics where query speed and concurrency are important. Actual latency and data retention depend on the platform, configuration and workload.
- Lakehouse platforms: Bring batch and streaming data together for analytics and machine learning. Databricks, for example, uses Delta Lake and structured streaming to support ongoing data processing alongside historical analysis, with shared storage and governance.
- Warehouse-native streaming: Extend an existing data warehouse with streaming ingestion and continuously updated transformations. Snowflake and BigQuery support approaches that let teams analyse incoming data using familiar SQL tools, although their processing models and latency characteristics differ.
The choice depends on what you're trying to achieve. A customer-facing application serving thousands of live queries has different requirements from an enterprise combining streaming data with years of historical records. Start with the workload, then choose the architecture that supports it without adding complexity you don't need.
Future alignment
- AI readiness: Check how easily the platform can supply current data to AI models and applications. Look at its support for model inference, integration with existing AI tools and the processing delays involved. Confirm whether the features you need are generally available or still in preview.
- Event-driven action: Consider how the platform connects analytics to operational systems through triggers, webhooks, workflows or serverless functions. Check whether these capabilities are built in or require additional services, particularly where automated actions need reliable delivery and error handling.
- Deployment flexibility: Assess cloud, hybrid and self-hosted options against your security, compliance and latency requirements, including edge processing where appropriate. Also consider how easily you can move data and workloads between systems if your requirements change.
A platform might meet every requirement today and still become expensive or difficult to maintain as workloads grow. Before committing, check its compatibility with your existing tools, the skills needed to operate it and how much work a future migration would involve. Those practical considerations are just as important as its technical capabilities.
Leading Real-Time Data Analytics Platforms for Enterprises
The leading platforms below offer different approaches to real-time data analytics, from streaming infrastructure and databases to cloud-based analytics platforms and tools for building real-time applications. Each has its own strengths, limitations and enterprise use cases, so the right choice depends on what your organisation needs to achieve.
We've selected these platforms based on their enterprise-ready capabilities, maturity, approach to real-time data processing and suitability for different workloads.
1. AWS Managed Service for Apache Flink

AWS offers a fully managed Apache Flink service for real-time stream processing, so teams can build and run applications without managing clusters. It integrates tightly with the wider AWS stack and supports Java, Scala, Python, and SQL for event-driven pipelines across clickstreams, IoT, and transactional data.
Enterprise-ready features
The service delivers low-latency, stateful processing with event time, windowing and complex event logic. Checkpointing and snapshots support recovery from failures, while exactly-once processing helps prevent duplicate results within supported parts of a pipeline. End-to-end guarantees depend on the connectors, configuration and destination systems involved.
Amazon CloudWatch provides monitoring and alerting, although teams still need to manage their application code and performance.
AWS supports current Apache Flink runtimes, including Flink 2.3, alongside integrations with Kinesis, Amazon MSK, S3 and other AWS services. IAM controls, VPC networking and encryption support enterprise security requirements. The service can scale applications automatically, but scaling depends on resource usage and configuration, and isn't always instantaneous.
Pros
- Deep integration across AWS services speeds ingestion and delivery.
- Managed infrastructure cuts operational overhead and scales automatically.
- Exactly-once processing supports data accuracy when correctly configured with compatible connectors and destinations.
- Flexible development in Java, Scala, Python and SQL.
- Enterprise security comes with VPC, IAM, and encryption by default.
Cons
- Best for AWS-first strategies rather than multi-cloud or on-prem.
- Flink’s learning curve can slow inexperienced teams.
- Continuous high-throughput jobs can be costly without optimisation.
Best for
Organisations standardised on AWS that need reliable, low-latency streaming ETL and event processing at scale, from IoT telemetry to real-time metrics and enrichment. It's a managed stream-processing service rather than a standalone analytical database, so processed data is typically sent to other systems for storage and querying.
2. ClickHouse Cloud

ClickHouse Cloud is the managed service for the ClickHouse OLAP database, engineered for sub-second SQL analytics at massive scale. It ingests data in near real time and serves interactive queries for dashboards, APIs and monitoring without the burden of running clusters.
Enterprise-ready features
Automatic clustering, replication and upgrades keep performance high while reducing ops. Streaming ingestion via Kafka and common pipelines makes fresh data instantly queryable, with materialised views and a powerful SQL dialect for complex aggregations and joins.
Access control, encryption and audit logging support governance, and efficient columnar storage with compression keeps costs down as data grows. Elastic scaling lets teams handle bursty workloads and pay only for what they use.
Pros
- Sub-second analytics on billions of rows for real-time use cases.
- Continuous ingestion makes new events immediately queryable.
- Fully managed service removes cluster toil and speeds delivery.
- Rich SQL feature set supports advanced analytical logic.
- Storage efficiency and compression help control total cost.
Cons
- OLAP focus requires thoughtful modelling to sustain peak speed.
- Not suited to OLTP transactions or workflow updates.
- Visualisation typically relies on external BI or custom apps.
Best for
High-concurrency, real-time analytics on large datasets, such as user-facing dashboards, telemetry analysis and log or network monitoring, where speed and cost efficiency both matter.
3. Confluent Data Streaming Platform (Kafka)

Confluent, founded by the creators of Apache Kafka, provides an enterprise streaming platform in the cloud and on premises. It acts as the backbone for data in motion, connecting applications and stores through real-time event streams with governance and processing built in.
Enterprise-ready features
Confluent combines managed Apache Kafka with connectors for databases, cloud services and business applications, helping enterprises move data between systems as events happen. Kafka Connect handles integration, while managed Apache Flink supports SQL-based stream processing, including filtering, joins and aggregations.
Kafka Streams and ksqlDB remain options for processing Kafka data, although their capabilities and deployment requirements differ from managed Flink. Schema Registry and Stream Governance help teams manage data formats, track lineage and control access to streaming data.
Confluent's Tableflow also makes Kafka topics available as Apache Iceberg or Delta Lake tables, so analytics and AI platforms can work with that data without teams building separate export pipelines. Availability varies by cloud provider and feature.
Confluent supports exactly-once processing in compatible Kafka and Flink workflows, but those guarantees don't automatically extend to every external system. Teams also need to consider the trade-off between delivery guarantees and latency.
Confluent Cloud manages much of the underlying infrastructure, although connector configuration, application design, monitoring and usage costs still need attention.
Pros
- Managed Kafka and a broad connector ecosystem support integration across enterprise systems.
- Managed Apache Flink supports SQL-based processing of live data streams.
- Schema Registry and governance improve data quality and trust.
- ksqlDB and managed Flink enable powerful real-time transformations.
- Tableflow makes Kafka data available to analytical platforms through open table formats.
Cons
- Kafka concepts and capacity planning add complexity for new teams.
- Requires pairing with analytic stores for querying beyond transport.
- Kafka, Flink, connector and Tableflow usage can create several cost components that need monitoring.
Best for
Enterprises building event-driven architectures that need a dependable streaming backbone to connect microservices, modernise data integration and feed real-time analytics with strong governance.
4. Databricks Lakehouse Platform

Databricks unifies data engineering, analytics and AI on a lakehouse architecture that treats streaming and batching as first-class citizens. Teams ingest live data into Delta Lake, analyse it with SQL or notebooks, and operationalise ML in the same environment.
Enterprise-ready features
Structured Streaming processes incoming data incrementally, while Delta Lake provides ACID transactions and schema enforcement to help keep data consistent. The former Delta Live Tables (DLT) functionality is now part of Lakeflow Spark Declarative Pipelines, which lets teams build and manage batch and streaming pipelines using SQL or Python.
It also supports change data capture (CDC), data quality checks, automatic recovery and pipeline monitoring. Unity Catalog provides centralised access controls, data lineage and governance across analytics and AI workloads. Lakeflow Jobs handles scheduling and orchestration, while serverless pipelines can automatically scale computing resources.
MLflow, model serving and Photon acceleration support the wider analytics and AI environment, although teams still need to monitor processing delays, resource usage and the cost of continuously running workloads.
Pros
- One platform for batching, streaming, and ML simplifies architecture.
- Delta Lake ensures reliability and consistency on live data.
- Lakeflow simplifies pipeline management with declarative processing, monitoring and data quality checks.
- Strong ML tooling and real-time model serving in the platform.
- Serverless compute, autoscaling and Photon help manage performance across different workloads.
Cons
- Breadth introduces a learning curve for new teams.
- Micro-batch model may not meet ultra-low latency needs.
- Continuous processing and serverless compute need careful monitoring to control costs.
Best for
Enterprises standardising on a single environment for pipelines, analytics and AI where streaming must sit beside historical data with shared governance and skills.
5. Google Cloud (Pub/Sub, Dataflow and BigQuery)

Google Cloud pairs Pub/Sub for messaging, Dataflow for processing and BigQuery for analytics to deliver a serverless, real-time stack. Events can move from Pub/Sub through Dataflow for processing before reaching BigQuery, or be written directly to BigQuery when complex stream processing isn't needed.
Enterprise-ready features
Pub/Sub handles messaging at scale, while Dataflow uses Apache Beam for stream processing, including windowing, event-time handling and transformations that depend on earlier events.
Dataflow supports autoscaling and offers exactly-once or at-least-once processing modes, depending on whether the workload prioritises accuracy or lower processing costs. BigQuery's Storage Write API supports streaming ingestion, making new records available for SQL queries with minimal delay.
Its default stream uses at-least-once delivery, while application-created streams can support exactly-once writes using offsets. BigQuery also offers continuous queries for processing incoming data using SQL, without requiring a separate Dataflow pipeline. IAM, encryption and Google Cloud Monitoring support security and observability, with Looker and BigQuery ML providing BI and machine learning capabilities.
Pros
- Fully managed services reduce operational burden.
- Direct ingestion and Dataflow pipelines give teams options for simple and complex streaming workloads.
- Near real-time SQL in BigQuery with familiar tooling.
- Strong AI and BI integrations out of the box.
- The global footprint supports multi-region reliability.
Cons
- Deepest value comes if you commit to GCP services.
- Beam/Dataflow concepts add a learning curve.
- Always-on streaming can drive costs without guardrails.
Best for
Teams that want a fast, serverless path to real-time dashboards and operational analytics using standard SQL, with tight integration to Google’s AI and BI ecosystem.
6. Materialize

Materialize is a streaming database that keeps SQL results continuously up to date. You write standard SQL for joins and aggregations, and it maintains materialised views so queries reflect the latest events.
Enterprise-ready features
Materialize uses incremental computation to update SQL results as new data arrives, rather than running the same queries from scratch. It supports native ingestion from Kafka, Redpanda, PostgreSQL, MySQL and SQL Server, including change data capture (CDC) from databases.
Its PostgreSQL-compatible interface makes it easier to connect existing tools, while support for complex joins and materialised views helps teams build live analytics. Data freshness depends on the source, workload and available resources, so updates aren't guaranteed to happen within milliseconds.
Materialize is available as a fully managed cloud service or as a self-managed deployment on Kubernetes, with Community and Enterprise editions. The managed option reduces infrastructure work, while self-managed deployments give organisations more control over where their data runs.
Both require attention to compute resources, memory usage and processing delays, particularly as the number and complexity of continuously updated views grows.
Pros
- True streaming SQL lowers the skills barrier.
- Incrementally updated views keep query results current without repeatedly processing entire datasets.
- ACID semantics provide trustworthy results.
- Handles complex joins that are hard in low-level engines.
- Postgres wire compatibility simplifies integration.
Cons
- Stateful views can be memory-heavy at a large scale.
- Self-managed deployments require Kubernetes expertise and ongoing infrastructure maintenance.
- Some data sources require additional integration tools rather than native connectors.
Best for
Product and data teams that want real-time dashboards, alerts and user-facing features built quickly with SQL, without managing a separate stream-processing codebase.
7. Microsoft Fabric Real-Time Intelligence

Microsoft Fabric brings streaming analytics, warehousing and BI into a single SaaS experience. Real-Time Intelligence uses Eventstream to collect and route incoming data, Eventhouse to analyse it and Activator to trigger actions when defined conditions are met. It also connects with Power BI and OneLake.
Enterprise-ready features
Eventstream provides no-code tools to collect, transform and route incoming data from sources such as Kafka, Azure Event Hubs and IoT devices. Eventhouse uses the Kusto engine and Kusto Query Language (KQL) to analyse large volumes of event, log and time-series data.
Teams can explore that data through Real-Time Dashboards or connect it to Power BI, while Activator monitors events and triggers alerts or workflows when specific conditions are met. Microsoft Purview integration supports data governance, alongside Fabric's workspace permissions and security controls.
Eventhouse also provides monitoring for ingestion, compute usage and storage. Although Fabric manages the underlying infrastructure, organisations still need to plan capacity and monitor consumption to avoid performance problems and unexpected costs. Core streaming, analytics and alerting capabilities are generally available, but some newer AI features, including AI agents for Real-Time Intelligence, remain in preview.
Pros
- Unified stack for streaming, BI and governance.
- Eventstream, Eventhouse and Activator bring ingestion, analytics and automated actions together.
- Kusto engine excels at telemetry analytics.
- No-code pipelines speed up first value.
- Real-Time Dashboards and Power BI support different reporting and monitoring needs.
Cons
- Some newer AI capabilities remain in preview and aren't suitable for every production requirement.
- Best fit for Microsoft-centric environments.
- Capacity planning and tuning need attention at scale.
Best for
Organisations on Microsoft stacks that want governed, real-time dashboards and analytics without stitching multiple Azure services, prioritising fast rollout and shared tooling.
8. Oracle MySQL HeatWave

MySQL HeatWave extends MySQL with an in-memory, massively parallel engine for analytics and ML. It combines transactional and analytical processing (HTAP), allowing MySQL-based applications to run analytics on operational data without first moving it into a separate warehouse.
Enterprise-ready features
HeatWave uses parallel, in-memory processing to accelerate analytical queries alongside MySQL transactions, reducing the need to copy operational data into a separate analytics system.
Its built-in AutoML supports model training, predictions and explanations through SQL, while HeatWave Lakehouse lets teams analyse data from object storage in formats including CSV, Parquet, Avro and JSON. Performance depends on the workload, available memory and cluster configuration, so acceleration isn't the same for every query.
MySQL HeatWave is available as a managed service on Oracle Cloud Infrastructure (OCI) and AWS, with access through Oracle's Azure integration. It also supports hybrid setups where transactional applications remain on premises and analytics run in the cloud.
MySQL access controls, encryption and high-availability options support enterprise operations, although organisations still need to plan capacity, monitor costs and check which capabilities are supported in their chosen deployment.
Pros
- Real-time analytics on operational MySQL with no ETL.
- Parallel, in-memory processing accelerates suitable analytical queries
- Built-in AutoML keeps ML close to the data.
- Fewer data copies reduce risk and complexity.
- Managed service simplifies deployment and scaling.
Cons
- In-memory processing requires careful capacity planning, particularly for large datasets and ML workloads.
- Deployment options and available features differ across OCI, AWS and Azure.
- Pure OLTP workloads may not justify the extra cost.
Best for
MySQL-centric teams that need immediate insight from live transactions, from fraud checks to real-time reporting, and prefer a unified system over adding a separate analytics database.
9. RisingWave

RisingWave is an open-source streaming database for cloud-native workloads that keeps SQL results current as events arrive. Its disaggregated architecture separates compute and storage to deliver real-time processing with a focus on simplicity and cost control.
Enterprise-ready features
RisingWave uses incremental computation to keep SQL materialised views updated as new data arrives, supporting joins, windowed aggregations and other streaming transformations. Its architecture separates compute from storage, using object storage to maintain persistent state without keeping everything in memory.
RisingWave also integrates with Apache Iceberg, allowing teams to write processed streaming data into open-format tables for use by other analytics platforms. RisingWave supports ingestion from Kafka, Redpanda and database change data capture (CDC), alongside a PostgreSQL-compatible interface for existing SQL tools.
Teams can use the fully managed RisingWave Cloud service or deploy the open-source software themselves using Docker or Kubernetes. Managed deployments reduce infrastructure work, while self-hosted installations give organisations more control over their environments but require ongoing monitoring, scaling and maintenance.
Pros
- Separated compute and storage can reduce memory requirements for stateful processing.
- Standard SQL lowers the learning curve for streaming analytics.
- Open source avoids lock-in and enables self-hosting.
- Horizontal scaling and Kubernetes readiness fit modern deployments.
- Apache Iceberg integration supports streaming data pipelines into open-format lakehouse tables.
Cons
- Self-hosted deployments require infrastructure management and operational expertise.
- Changing materialised view definitions can require rebuilding views and managing dependent pipelines.
- Existing Kafka and Flink environments may need additional integration and migration work.
Best for
Teams building fresh, cloud-native streaming pipelines that want SQL-first development, lean operations and lower memory costs, from IoT time windows to real-time product analytics.
10. Snowflake (Snowpipe Streaming and Dynamic Tables)

Snowflake extends its warehouse with Snowpipe Streaming for low-latency ingestion and Dynamic Tables for continuous SQL transformations, bringing real-time data alongside historical analytics in one governed platform.
Enterprise-ready features
Snowpipe Streaming ingests data directly into Snowflake tables without staging files, using APIs and connectors for sources such as Kafka. Its newer high-performance architecture supports two ingestion modes: Elastic Channels provide at-least-once delivery, while Named Channels support ordered, exactly-once ingestion when applications correctly manage source offsets.
Dynamic Tables then automate SQL transformations using incremental or full refreshes, with configurable data freshness targets rather than guaranteed continuous updates. Snowflake's virtual warehouses provide compute resources for queries and Dynamic Table refreshes, while its access controls, encryption and governance features apply across streaming and historical data.
Snowpark supports Python and Java processing alongside SQL. Teams need to monitor ingestion volumes, warehouse usage and refresh costs, particularly when shorter freshness targets increase processing demand. Snowflake suits near-real-time analytics within an existing data platform, but applications requiring consistently millisecond-level responses may need a specialised analytical engine.
Pros
- Real-time data and analytics in a familiar warehouse with standard SQL.
- Dynamic Tables reduce streaming ETL engineering effort.
- Strong governance, security and multi-cloud operations.
- Connectors and APIs simplify ingestion from Kafka and apps.
- Unified skills and tooling accelerate adoption.
Cons
- Dynamic Table refresh targets aren't guaranteed, so processing delays can affect data freshness.
- Continuous ingestion and frequent transformations can increase costs without careful monitoring.
- Warehouse-native processing may not meet applications that require consistently millisecond-level analytics.
Best for
Enterprises already on Snowflake that want near real-time dashboards and pipelines without adding a separate streaming stack, keeping BI, models and governance in one place.
11. StarTree (Apache Pinot)

StarTree delivers a managed platform for Apache Pinot, the real-time OLAP datastore built for low-latency, high-concurrency analytics on fresh event data, including user-facing products and operational dashboards.
Enterprise-ready features
Apache Pinot ingests streaming data from sources such as Kafka and Kinesis alongside historical data. Its columnar storage and indexes, including inverted, sorted and star-tree indexes, help accelerate analytical queries. Pinot also supports upserts and deduplication, allowing teams to update existing records or filter duplicates during ingestion.
These features require careful configuration, and some indexing options can't be combined with upsert tables. StarTree Cloud adds managed cluster operations, ingestion tools, monitoring, access controls and automated performance tuning. It also offers deployment options in StarTree's cloud, a customer's cloud account or an existing Kubernetes environment.
StarTree provides additional capabilities for scaling upserts and querying external lakehouse data, while its separate ThirdEye tool supports anomaly detection. Query speed and data freshness depend on the workload, indexing choices, ingestion rate and available resources.
Pros
- Indexing and query optimisation support low-latency analytics at high concurrency.
- Real-time plus historical data in a single fast store.
- Managed service reduces cluster complexity.
- Rich indexing accelerates selective and high-cardinality queries.
- Managed operations and performance tuning reduce the work involved in running Pinot.
Cons
- Designed for analytical queries rather than transactional database workloads.
- Indexing, upsert and deduplication settings require careful planning and can increase resource usage.
- Query performance and data freshness depend on workload design and capacity.
Best for
Applications and internal portals that need interactive, low-latency analytics on fresh events at high concurrency, from product telemetry and metrics exploration to anomaly detection.
12. Tinybird

Tinybird turns streaming and batch data into low-latency APIs backed by ClickHouse. Teams ingest events, build transformations as SQL “Pipes”, and publish results as HTTPS endpoints for apps and dashboards.
Enterprise-ready features
Tinybird ingests streaming events through its HTTP Events API and Kafka connector, alongside batch data from files and cloud storage such as Amazon S3 and Google Cloud Storage.
Teams use SQL Pipes to transform data, create materialised views and publish queries as HTTPS API endpoints for applications. Its managed ClickHouse infrastructure handles the underlying database operations, while query monitoring helps developers identify performance problems.
Tinybird supports development through a command-line interface, TypeScript and Python SDKs, local testing and cloud branches for testing changes before deployment. Resources can be stored as code and deployed through CI/CD pipelines.
Tokens and role-based permissions control access, while enterprise options include dedicated infrastructure, private networking, SSO and private regions. Response times depend on query design, data volumes and available compute resources, rather than being guaranteed at millisecond speeds.
Pros
- Developer-first: SQL-to-API flow shortens time to product.
- Managed ClickHouse and SQL-based APIs support low-latency analytics for applications.
- Managed service removes operational overhead.
- Strong CI/CD integration supports data-as-code practices.
- Local development, cloud branches and SDKs support testing and iterative delivery.
Cons
- Shared infrastructure has capacity limits, while dedicated enterprise deployments require more planning and cost management.
- Complex data transformations or application logic may still require external processing services.
- Teams have less direct control over the underlying ClickHouse infrastructure than with self-managed deployments.
Best for
Teams that need real-time metrics and aggregation APIs quickly — powering customer dashboards, product analytics, and operational views — without building and running a custom data backend.
Common Implementation Challenges (and How To Overcome Them)
Even with the right platform, real-time programmes can stumble without clear guardrails. Focus execution on four areas.
Cost and complexity: Real-time pipelines can become expensive when they're running around the clock, even on managed platforms. Managed and serverless services can reduce infrastructure work, but they aren't always cheaper.
Compare the costs of ingestion, processing, storage and data transfers before committing, and remember to account for monitoring and maintenance. Filter unnecessary data early, set budgets and usage alerts, and choose services that suit how often your workloads actually run.
Data governance and quality: Build trust into the stream. Enforce schemas and access controls from the start, use a schema registry or data contracts, and run automated quality checks that quarantine bad records. Document streams, track lineage, and tie pipelines into existing catalogues and security controls so compliance is continuous, not an afterthought.
Integration complexity: Connecting many sources and sinks adds friction. Lean on unified platforms, iPaaS, and pre-built connectors; when custom work is needed, standardise on CDC for databases, and webhooks or REST for apps. Decouple producers and consumers through an event bus, such as Kafka or Pub/Sub, and agree on common data models early to minimise one-off transformations.
Skills and culture gap: Streaming needs new habits as well as new tools. Managed platforms and SQL-first options can make development easier, but teams still need people who understand data pipelines, performance, monitoring and how to recover when something goes wrong.
Invest in training and start with a manageable use case before expanding. Give a cross-functional team clear responsibility for keeping the system running, and bring in experienced partners where specialist knowledge is missing.
The Future of Real-Time Analytics
Real-time analytics is becoming more closely connected to the systems businesses use to make decisions and take action. Some platforms already support live anomaly detection, predictive models and automated responses when certain conditions are met. The next challenge for enterprises is making these capabilities reliable enough for everyday use.
That means looking beyond how quickly a platform processes data and considering whether its results are accurate, explainable and useful to the people or systems acting on them. Generative AI is also changing how people interact with analytics. Natural-language interfaces can help users explore data without writing SQL, while AI assistants can explain trends or help investigate unusual activity.

But connecting an AI model to live data doesn't guarantee an immediate or correct answer. Enterprises need to check how these tools access current information, handle delays and verify their responses before relying on them for important decisions.
Observability is another area worth watching. Modern platforms can already monitor processing delays, failed jobs and data quality, while some offer automated recovery from certain failures. What they can't do is guarantee that every problem will be detected or fixed without intervention.
Teams should look for clear monitoring, alerts, recovery options and data lineage so they can understand where something went wrong and what needs to happen next. Edge analytics remains important wherever sending every event to the cloud would introduce too much delay or use unnecessary bandwidth.
Factories, vehicles and connected devices can process some data locally and send selected results to central platforms. The practical question is how well a platform supports this mix of local and cloud processing, including what happens when connectivity is interrupted. Event-driven automation is already possible through tools that watch incoming data and trigger actions when defined conditions are met.
These might include sending an alert, starting a workflow or adjusting a process. More advanced decisions can involve predictive models, but they need safeguards, testing and human oversight, especially when an incorrect response could disrupt operations.
For enterprises choosing a real-time analytics platform, the priority is understanding which decisions genuinely need live data and how much automation they're prepared to trust. Some workloads will benefit from immediate processing, while others can still run perfectly well in batches.
The strongest approach is one that gives teams the right information at the right time, with enough control to act on it responsibly.
Final Thoughts: Speed Only Matters When It’s Strategic
Speed without purpose achieves little. Real-time analytics creates value when it helps organisations make better decisions at the moment they're needed. Whether it's tracking changes in customer behaviour or identifying problems before they disrupt operations, those decisions still depend on accurate, trustworthy data.
The priority is knowing where real-time processing makes a genuine difference and where traditional batch analytics will do the job just as well. Enterprises need to consider the costs, governance requirements and practical outcomes of each use case before investing in faster systems. After all, getting information sooner doesn't help much if nobody can trust it or act on it.
For more perspectives on turning real-time data into enterprise advantage, explore EM360Tech’s latest insights on data strategy, AI integration, and intelligent automation.


Comments ( 0 )