
There's a particular kind of exhaustion that comes with modern security work. It isn't a shortage of information but actually quite the opposite. Security teams are drowning in it from alerts, logs, AI-generated summaries, and twenty-page reports nobody has time to read properly. So when AI promises to cut through the noise, the obvious question is whether it's actually helping, or just creating more work at a faster pace.
This was the question at the heart of this episode of the Security Strategist Podcast, where host Trisha Pillay sits down with with Dan Williams, Chief Product Officer at Cambridge Intelligence, to talk about the role visualisation plays as AI takes on more of the analytical heavy lifting in cybersecurity.
Complex Security Data
Cambridge Intelligence may not be a name most people recognise, but its technology sits behind many of the security products organisations already use. The company’s roots go back around 15 years to the law enforcement and intelligence world, where investigators were dealing with a simple problem of trying to make sense of thousands of connections between people, places, devices and transactions.
The answer was to make those relationships visible. Instead of working through rows of data or pages of reports, investigators could map connections and see patterns that were difficult to spot in a spreadsheet. That approach, known as link analysis or graph visualisation, has since expanded beyond law enforcement into areas such as financial crime, supply chains and cybersecurity.
Today, that same principle is being applied to increasingly complex security environments. Teams may have thousands of alerts, cloud assets, identities and activity logs to work through. The challenge is no longer simply collecting the information; it is giving people enough context to understand what matters and what they should do next.
This is where Cambridge Intelligence sees its role. As Williams explains, the company sits between the underlying data and the person trying to make sense of it. This means essentially providing the “last mile” of the data. The technology turns complicated information and relationships into something people can explore visually. By doing this, it helps them move from raw information to understanding and being able to make a decision based on the data seen.
The human layer is still very important as AI takes on more of the work of detecting patterns and raising alerts. AI may be able to identify something unusual, but security teams still need to understand the context behind that finding before they can decide what to do about it. Visualisation can help bridge that gap by showing how an alert connects to the wider environment.
Exploring Data to Explaining It
In the early days of threat intelligence, graph visualisation gave security teams a way to investigate connections between threat actors, malware, IP addresses and vulnerabilities. Analysts could explore the data themselves and look for patterns. This approach becomes harder to sustain as security data grows.
Most cybersecurity professionals aren't specialist threat analysts, and no one is going to manually examine billions of transactions to find a suspicious one. The technology needs to do more of the searching. But finding something isn't enough; security teams also need to understand why this is important. This is the shift Williams describes as moving from “explore” to “explain”. A small group of specialists may still want to investigate the raw data, but most users need the relevant information presented with enough context to make a decision.
Cloud security is a good example of how modern attacks can involve an enormous web of systems, identities and vulnerabilities, creating graphs with potentially billions or even trillions of relationships. The answer isn't to put all of that information on one screen. It is to show the part that matters.
When Security Becomes Data
Visual analytics is redefining cyber defense, turning fragmented threat events into an intelligible picture for faster, evidence-based action.
Williams compares it to following a route from A to B. The destination isn't enough; you need the important waypoints along the way, essentially a map. In cybersecurity, those might be the systems an attacker could reach, the data that could be exposed or the single vulnerability that could stop the attack from spreading. Good visualisation, then, isn't about showing everything. It's about showing enough to understand what matters.
Giving Security Teams the Bigger Picture
Identity and access management creates a similar problem. Security teams are dealing with huge volumes of login activity, API calls and increasingly non-human identities, making raw logs difficult to interpret. Logs can tell you what happened, but they don't always make the relationships between those events obvious. Graph visualisation can add that missing context by showing who has access to what, which groups they belong to and how a change in one part of the environment could affect another. Analysts can still drill into individual events when necessary, but they get the wider picture first.
There is an obvious trade-off, though. Simplify a security environment too much and important context disappears. Show everything and the result becomes another overwhelming dashboard. Williams describes finding that balance as more art than science. The right view depends on the question being asked. A CISO looking for an overall risk picture needs something very different from an analyst investigating a specific incident. The goal isn't to make security data simpler for the sake of it. It's to make complexity easier to navigate.
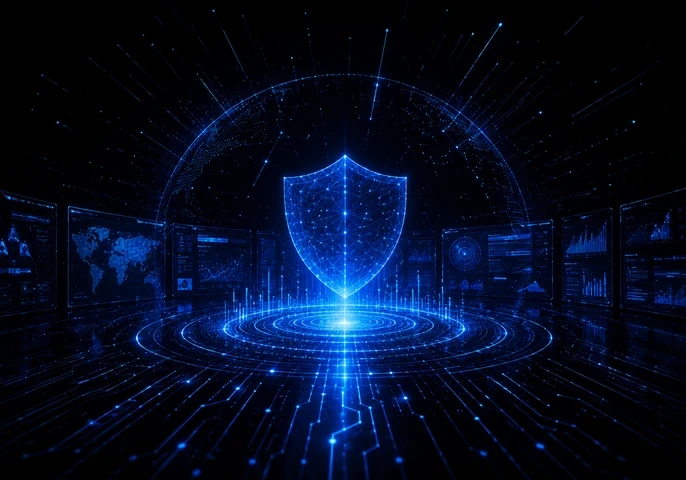
Inside the Agentic SOC Stack
See how unified telemetry, correlation engines and agentic AI workflows rebuild SOC architecture for autonomous detection and response.
What Should Security Leaders Ask Their Vendors?
Williams' advice to CISOs is: Can you explain what your security technology is doing? If you can't sketch it out on a whiteboard or explain how it reaches its conclusions, that's worth questioning. Security technology doesn't need to be simple, but the people responsible for it need to understand enough about what's happening behind the scenes to trust it. And that brings the conversation back to the wider role of visualisation.
As AI takes on more of the work involved in detecting and analysing threats, security teams need ways to understand those decisions rather than simply accept them. The value of visualisation isn't making security data look better. It's turning complexity into something people can understand and act on.
Takeaways
- The role of visualisation in cybersecurity and AI.
- The importance of context and storytelling in security data.
- How visualisation shifts from investigation to explanation.
- Balancing information overload with clarity.
- The human element in AI-driven security decisions.

Cambridge Intelligence is an ISO 27001-certified provider of data visualization SDKs. Its technology is used for building graph, timeline and geospatial applications that help users explore and understand complex, connected data. Its products are used in mission-critical software across industries including cybersecurity, intelligence, financial crime and fraud detection, supply chain, IT management and risk and compliance. Built for performance, reliability, scale and security, the SDKs give product teams and developers the tools to create visualizations that are powerful for analysts, flexible for developers and trusted in high-stakes environments.


Comments ( 0 )