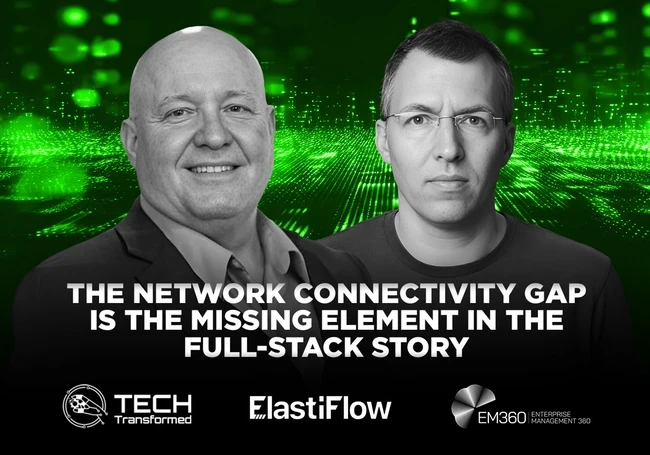
Tech leaders are often led to believe that they have “full-stack observability.” The MELT framework—metrics, events, logs, and traces—became the industry standard for visibility. However, Robert Cowart, CEO and Co-Founder of ElastiFlow, believes that this MELT framework leaves a critical gap.
In the latest episode of the Tech Transformed podcast, host Dana Gardner, President and Principal Analyst at Interabor Solutions, sits down with Cowart to discuss network observability and its vitality in achieving full-stack observability.
The speakers discuss the limitations of legacy observability tools that focus on MELT and how this leaves a significant and dangerous blind spot. Cowart emphasises the need for teams to integrate network data enriched with application context to enhance troubleshooting and security measures.
What’s Beyond MELT?
Cowart explains that when it comes to the MELT framework, meaning “metrics, events, logs, and traces, think about the things that are being monitored or observed with that information. This is alluded to servers and applications.
“Organisations need to understand their compute infrastructure and the applications they are running on. All of those servers are connected to networks, and those applications communicate over the networks, and users consume those services again over the network,” he added.
“What we see among our growing customer base is that there's a real gap in the full-stack story that has been told in the market for the last 10 years, and that is the network.”
The lack of insights results in a constant blind spot that delays problem-solving, hides user-experience issues, and leaves organizations vulnerable to security threats. Cowart notes that while performance monitoring tools can identify when an application call to a database is slow, they often don’t explain why.
“Was the database slow, or was the network path between them rerouted and causing delays?” he questions. “If you don’t see the network, you can’t find the root cause.”
The outcome is longer troubleshooting cycles, isolated operations teams, and an expensive “blame game” among DevOps, NetOps, and SecOps.
Elastiflow’s approaches it differently. They focus on observability to network connectivity—understanding who is communicating with whom and how that communication behaves. This data not only speeds up performance insights but also acts as a “motion detector” within the organization.
Monitoring east-west, north-south, and cloud VPC flow logs helps organizations spot unusual patterns that indicate internal threats or compromised systems used for launching external attacks.
“Security teams are often good at defending the perimeter,” Cowart says. “But once something gets inside, visibility fades. Connectivity data fills that gap.”
Isolated Monitoring to Unified Experience
Cowart believes that observability can’t just be about green lights and red lights, or whether a switch is on or off. It has to stress the experience, not only the user’s but also how one application interacts with another.
“The biggest shift organizations need to make,” the ElastiFlow CEO advises, “is to move from infrastructure health to usage experience. What really counts is whether the service being delivered is performing as it should.”
A unified experience can be achieved if leaders disband conventional barriers between teams. Imagine a Venn diagram where DevOps, NetOps, and SecOps overlap—each relying on network data as a common source of truth. The network becomes the central point that connects performance, reliability, and security around shared goals as per Cowart.
This philosophy supports ElastiFlow’s latest innovation – integrating network flow data directly into OpenTelemetry traces. Rather than treating network analytics as a separate console, ElastiFlow now includes connectivity information as part of the same trace that developers and SREs use to monitor applications.

Why Networks Define IT Strategy
See how LANs, WANs and cloud networks turn connectivity from basic plumbing into a core lever for efficiency, flexibility and cost control.
“It’s the first time anyone has done this,” Cowart points out. “An engineer can now see within their observability platform not just an HTTP call but also the related network session, latency, and context—all in one view.”
By embedding the “fifth pillar” of observability—network flows— ElastiFlow aims to prepare organizations for future challenges. With Kubernetes, hybrid cloud, and microservices making the network more abstract yet increasingly essential, visibility at this level is no longer optional; it’s strategic.
“As infrastructure becomes self-healing and redundant,” Cowart concludes, “leaders need to concentrate less on isolated device health and more on the experience being delivered. That’s where the business value lies, and that’s where the network finally becomes clear.”
Takeaways
- Legacy observability tools often overlook network connectivity.
- The MELT framework leaves a critical gap – network flow data.
- Network blind spots lead to extended troubleshooting cycles.
- XOps (NetOps, DevOps, SecOps) data siloshinder effective problem resolution.
- Security threats exploit the lack of network visibility, especially in east-west traffic.
- Network flow data is essential for comprehensive observability.
- Integrating application context enhances network data utility.
- Collaboration between IT teams is necessary for effective observability.
Inside Nokia’s Network Pivot
From brick phones to 5G, IoT and patents, Nokia’s handset exit reshaped it into a critical but quieter infrastructure player.

Chapters
- 00:00 Introduction to Network Observability
- 06:04 The Blind Spot in Traditional Observability
- 12:08 Security Implications of Network Observability
- 18:03 Integrating Network Data with Application Context
- 24:08 Future of Comprehensive Observability


Comments ( 0 )